


Serving real-time embeddings at scale is incredibly challenging. To launch Exa Highlights, we 4X’ed throughput by migrating from Python to Rust.
Here’s how we did it and what we learned about LLM bottlenecks
The Problem Statement
Exa Highlights lets users extract chunks of content from any result’s webpage. In real time, we chunk and embed the full content of each result and find the top chunks. We wanted to optimize our throughput to serve production on one 8xA100 node.
“We wanted to optimize our throughput to serve production on one 8xA100 node”Hubert Yuan - on the objective of this project
Parallelize Parallelize Parallelize
Our highlights pipeline involves both hefty CPU text pre-processing and GPU model inference. If we called these operations directly, the Python GIL would cause us to saturate at 1 CPU on a 128-CPU node, and our A100s would sit idle.
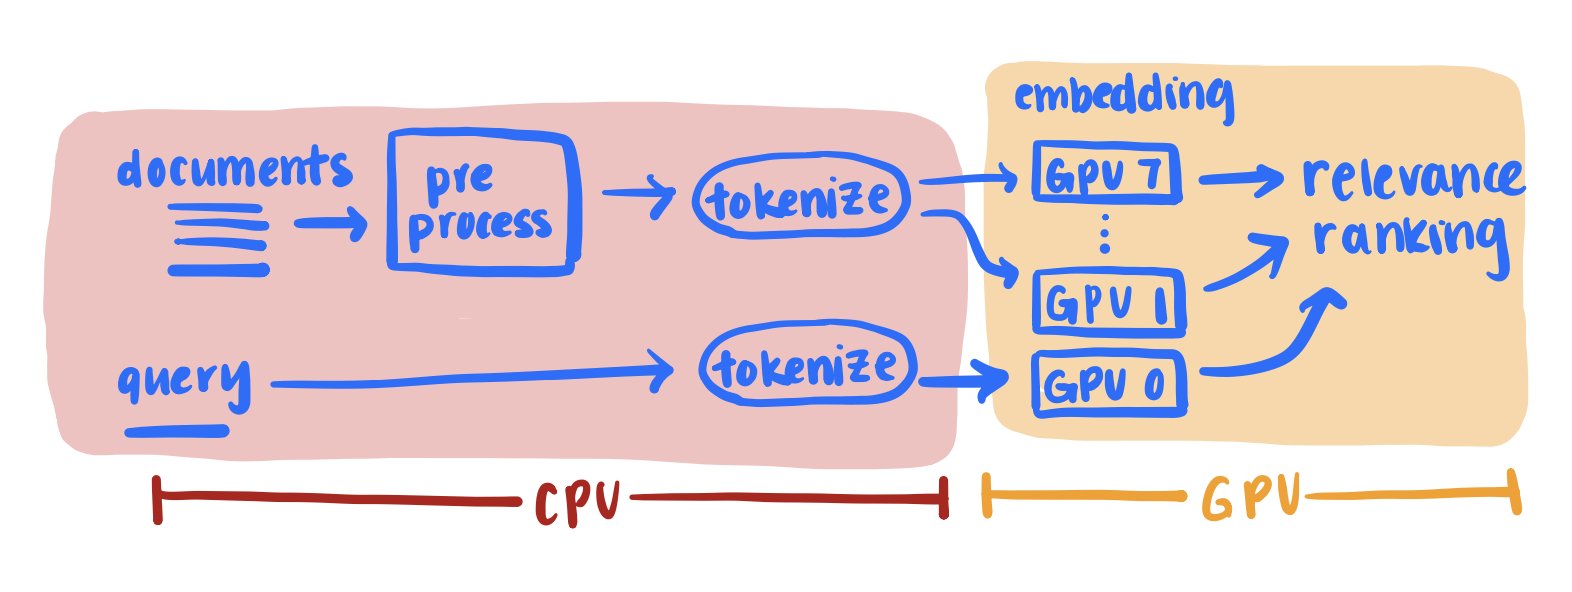
We created dozens of processes serving each CPU-bound stage, connected with queues. The goal was firstly to offload work to other cores to unblock the GIL, and secondly to split and parallelize CPU tasks to reduce latency. We also split big inference jobs across GPUs.
Watch your timing
Measurements are paramount when optimizing, but we ran into some tricky pitfalls. Here's the story:
We investigated GPU time spent on communication vs. computation and measured over half the time spent in communication. That didn't seem quite right.
The issue was that CUDA operations are async. Pytorch functions return instantly when
possible, blocking only if computed values are needed. Adding torch.synchronize()
before timing showed it was really compute-dominated. But our A100s weren't getting hot. How about
the CPUs?
All the CPUs were working, which was a good sign, but they were far from maxed. Low utilization on both CPU and GPU pointed to a synchronous bottleneck. But where? The main process was just offloading tasks as fast as worker processes could complete them... right?
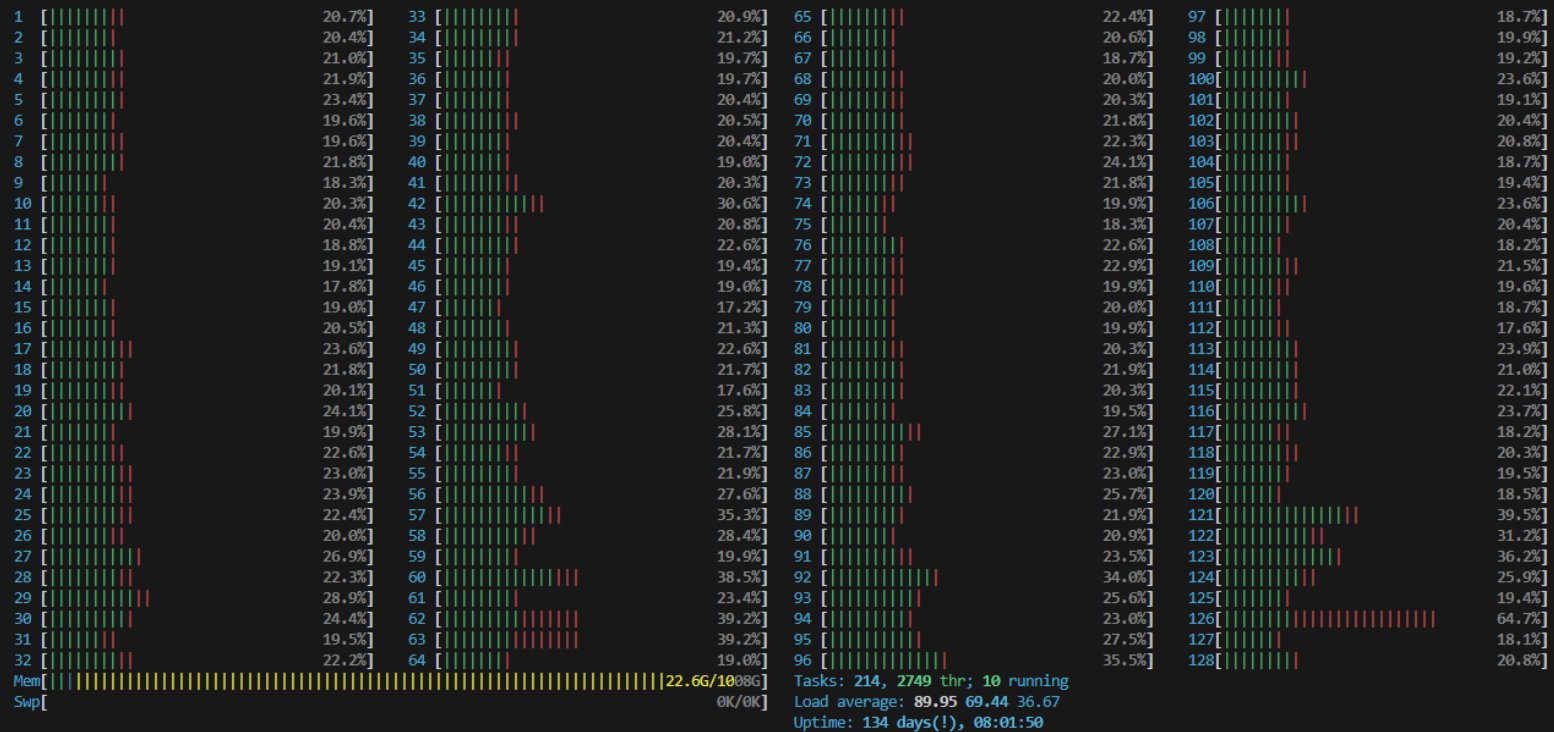
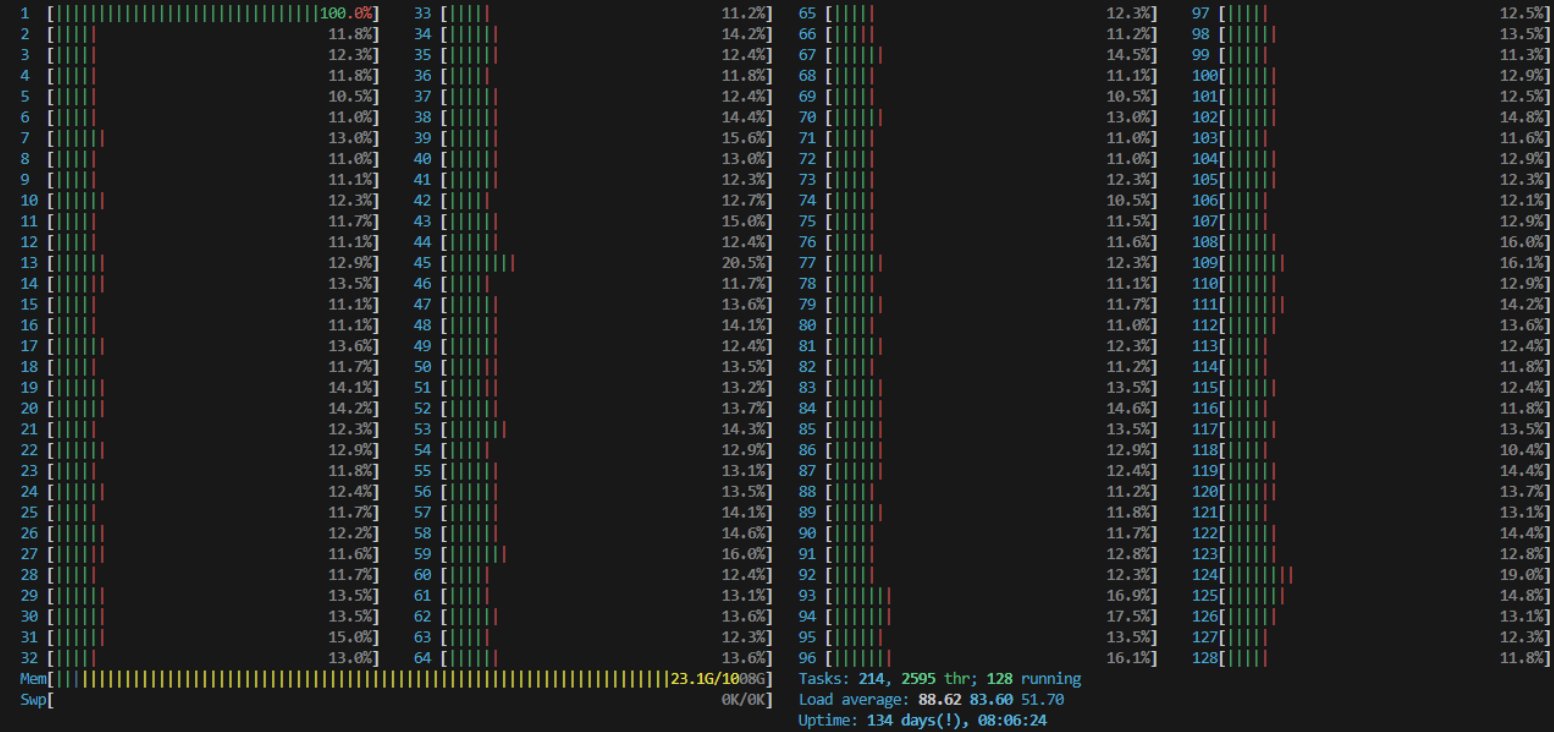
The issue was that the OS freely schedules the main Python process among CPUs, hiding GIL contention from view. As a quick hack to see the effect, we set the CPU affinity of the main process to 0, forcing it to the first CPU. Boom, instant 100%. GIL-blocked IPC was holding us up.
Just write it in Rust
We made some progress optimizing IPC abstractions to take load off the main process. But finally we concluded we'd outgrown Python's parallelism model. Switching to Rust let us write cleaner code, working directly on the memory while staying safe.
Without needing to dance around the GIL, parallelism in Rust was dead simple: we wrote serial
batched code, then replaced the serial iterator with a parallel one from rayon. We nested this
in a thread for each request, and served our Torch model with tch-rs.
|
|
|
|
|
|
|
|
|
|
What was our reward?
With the multiprocessing overheads removed, our throughput quadrupled. This was beyond expectation, since our previous CPU utilization was > 25%. So much of it was wasted on IPC! We celebrated a little, gave the new system a stress test, then...
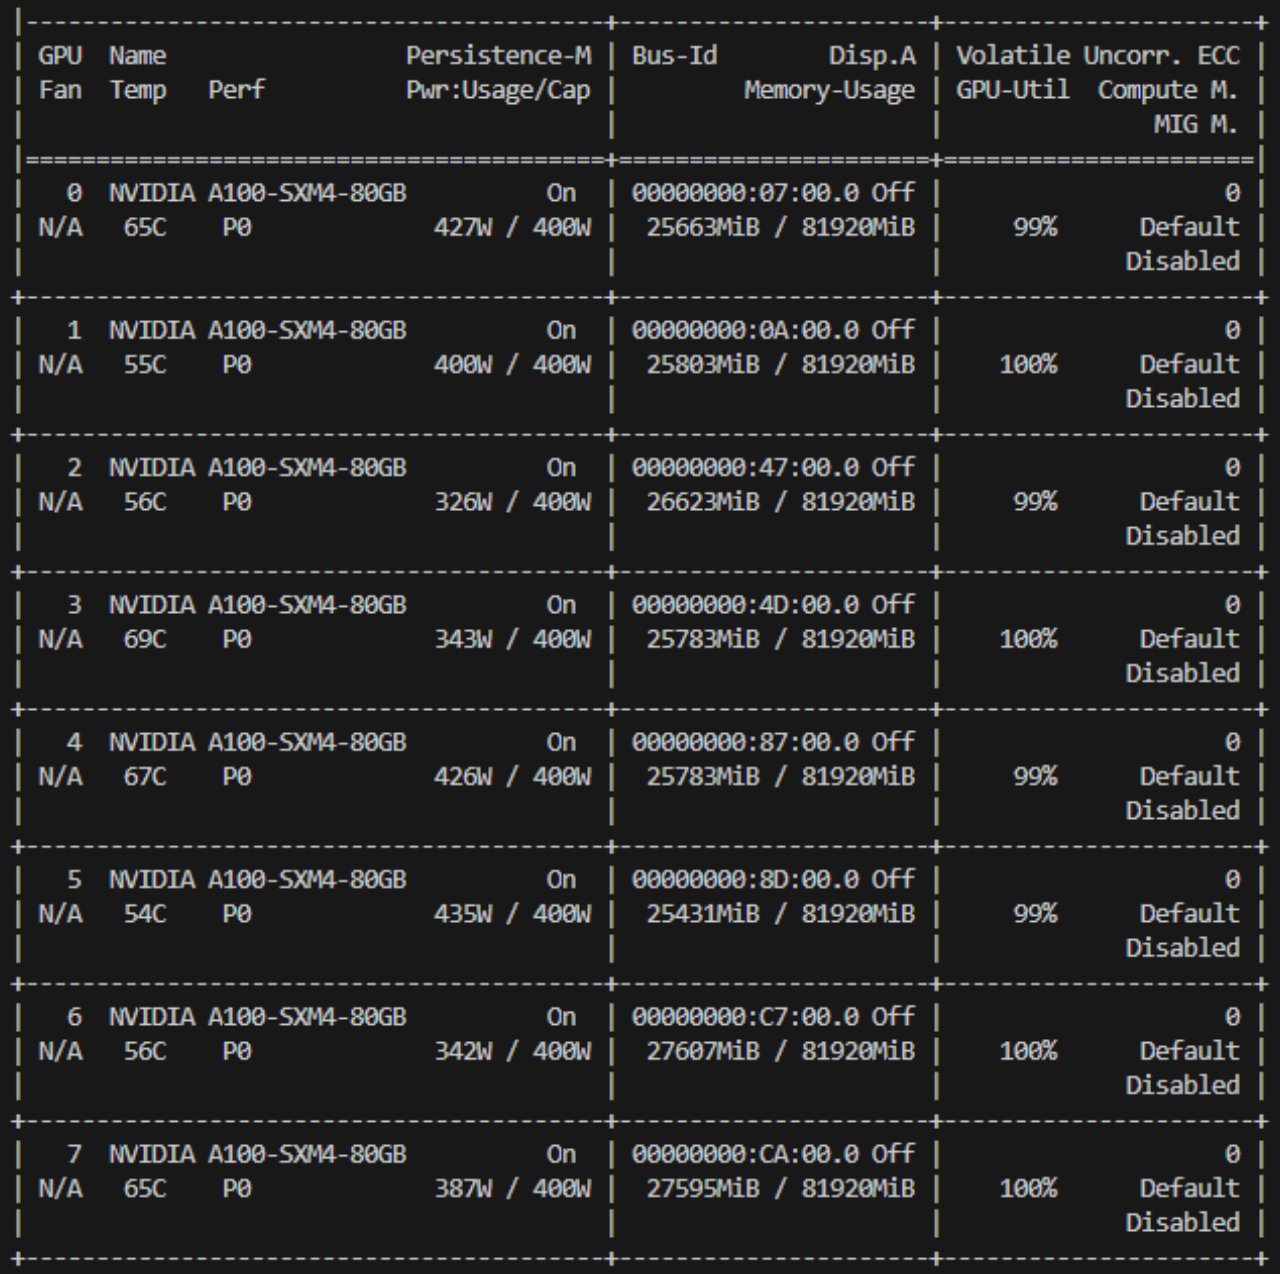
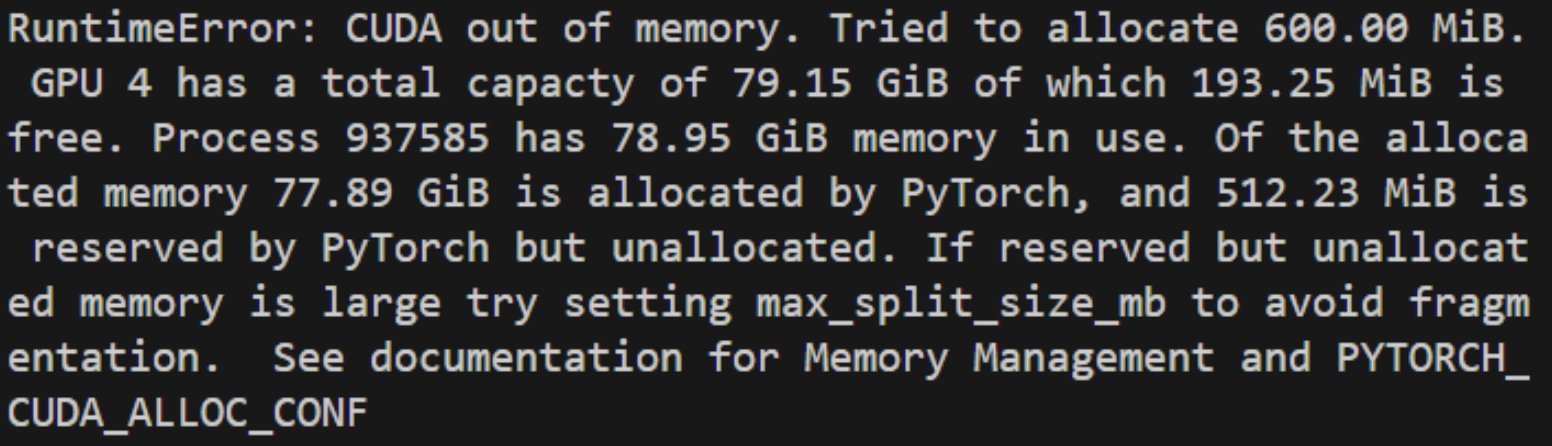
CUDA out of memory error?! 😱
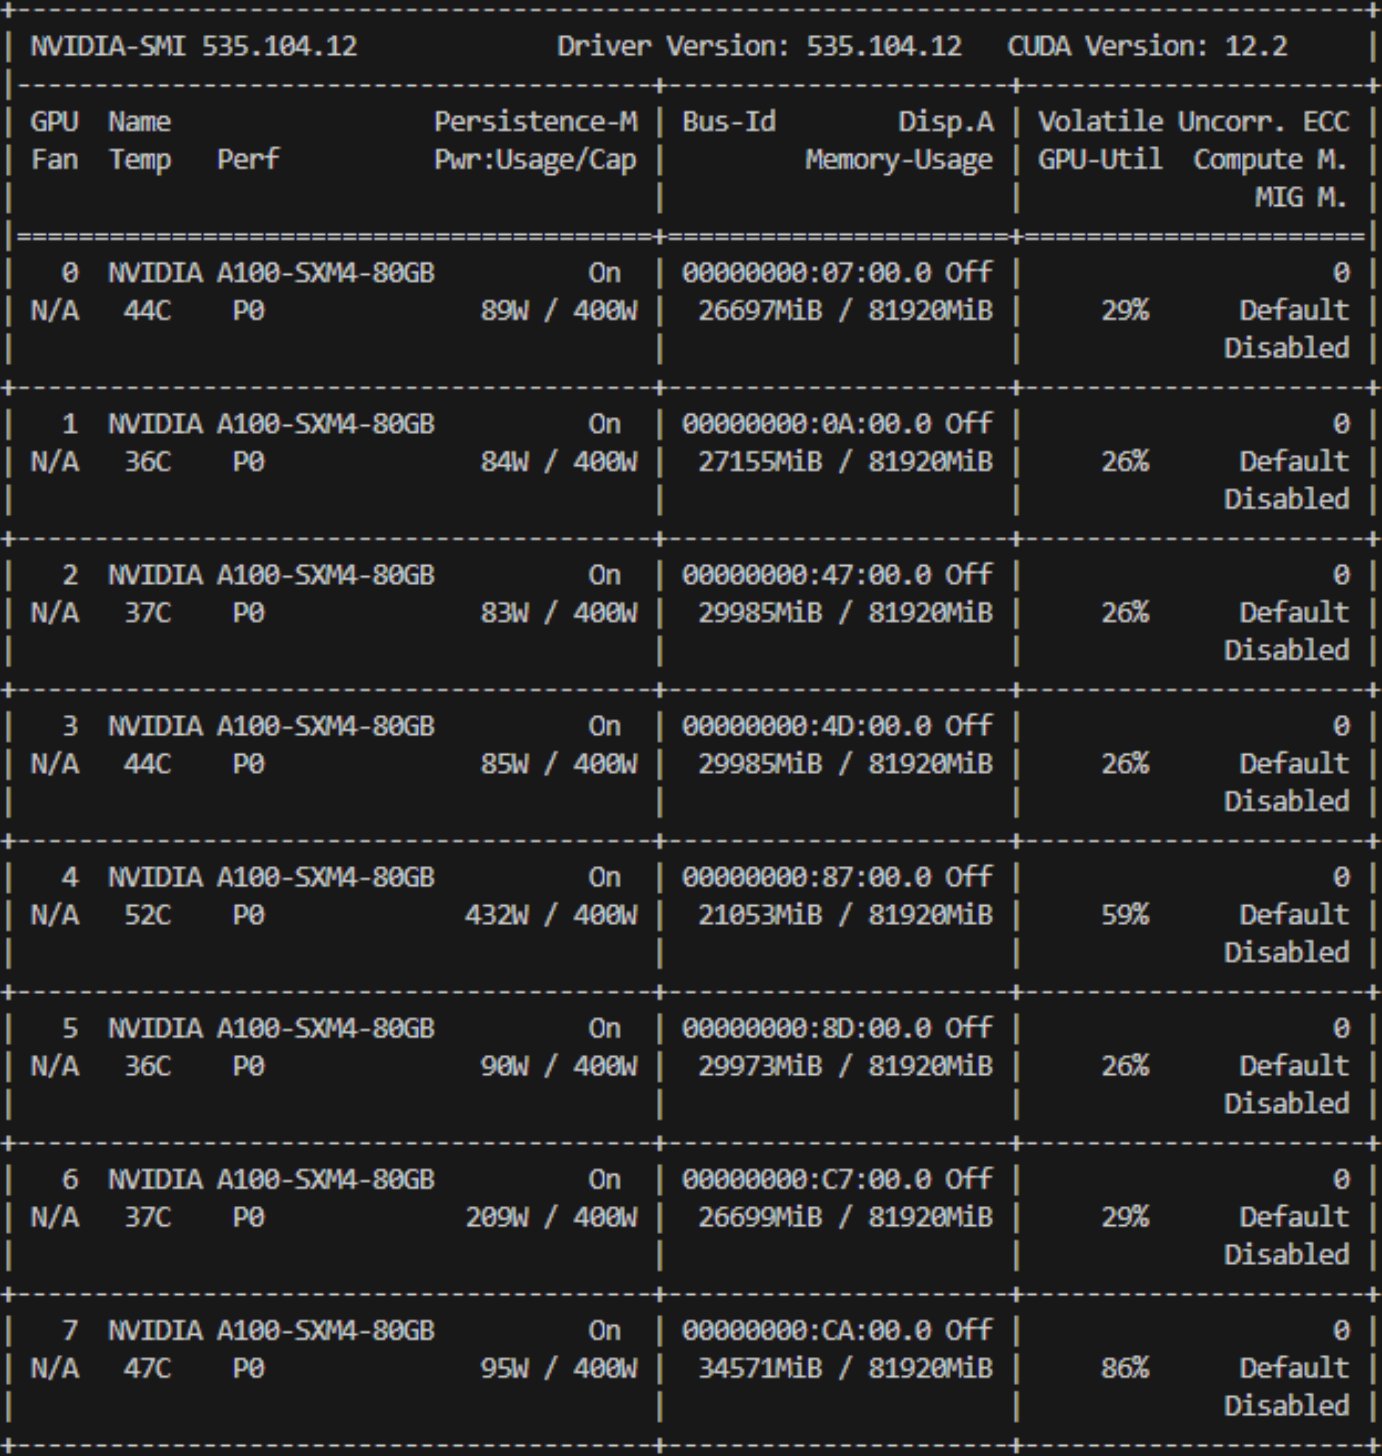
On an 80GB A100? We were sure that each GPU ran only one inference job at a time, and the biggest jobs took no more than 10GB of memory. A clue: attempted allocation was always less than available memory + reserved memory. Fragmentation?
We narrowed down the cause to using rayon's parallel iterators for data parallelism across separate GPUs. Making CUDA calls this way through Tch was not thread safe, and was interfering with timely tensor deallocation.
Luckily, it turned out serial iterators worked just as well, due to async CUDA! We just had to refactor inference and bring results back to CPU into separate passes. This solved our thread count and OOM issues, and Highlights has been up to this day.
There’s much more we can do here, such as zero-allocation inference, quantization, cloud migration, etc.
If you’d like to build web-scale performance-critical systems, Exa’s got lots of projects for you — come join!